Category Archives: vROPs

Cloud Management Monthly – Manage Your Infrastructure Like a Cloud Provider

In this episode of Cloud Management Monthly, Dan and Matt talk with Brandon Gordon, Staff Technical Marketing Architect at VMware, about what it takes to manage your infrastructure like a cloud provider. Brandon also shows off his amazing ROI vROps dashboard that he created! Dan and Matt talk a bit about VMworld 2020 and review the Cloud Management announcements.
Brandon’s Twitter – https://twitter.com/ImNotoriousBDG
Learn more and download Brandon’s dashboard here:
https://blogs.vmware.com/management/2020/05/roi-dashboard-for-vrealize-operations-8-1.html

Cloud Management Monthly – The Future of vROps with guest Sunny Dua

In this episode Dan and Matt discuss with Sunny Dua, a Sr. Product Line Manager at VMware, the future of VMware’s vRealize Operations and how vROps 8.2 is just the beginning. We also chat with Sunny about the impact of the California fires and what his plans are for attending an all virtual VMworld 2020.

Alan Renouf fire relief fund – https://gf.me/u/yucskh
Sunny’s website – https://sunnydua.com
Sunny’s Blog –
http://vxpresss.blogspot.com
Sunny’s Twitter –
https://twitter.com/sunny_dua

Would you rather listen to Dan and Matt talk about Cloud Management? Yes.. you’re in luck!
Podbean:
https://cmmonthly.podbean.com
Apple Podcasts:
https://podcasts.apple.com/us/podcast/cloud-management-monthly/id1521967240
Google Podcasts:
https://podcasts.google.com/feed/aHR0cHM6Ly9mZWVkLnBvZGJlYW4uY29tL2NtbW9udGhseS9mZWVkLnhtbA
Spotify:
https://open.spotify.com/show/3lqbJay72woluQBSMH3O8E?si=Io6y12zZQCCozz3nt_8Q2A

VMworld 2017 Must See Sessions

Hey Everyone!  Wow I cant believe we are already looking forward to VMworld 2017.  Its back again this year in Las Vegas and if you have never attended or haven’t registered yet, you definitely should!  Its a great opportunity to learn about emerging virtualization technology and meet and socialize with your peers. Its really a great time.  You can check out a recap of my VMworld 2016 right here.

Every year VMworld releases a few weeks prior to the schedule builder going live the content catalog.  Its always fun to search through all the great sessions and start to ear mark the ones I want to attend.  Often by the time the schedule builder goes live if you don’t choose your sessions a head of time many sessions will fill up quickly and you will be left out in the cold! (well its hot in Vegas, but you know what I mean). With that said, below is the list of some of the session that I feel are going to be awesome and I’m going to register for.  Here is the link for the VMware US Content Catalog – https://my.vmworld.com/scripts/catalog/uscatalog.jsp

vRealize Operations Capacity Explained (MGT1599BU)
This is an absolute must see!  At VMworld 2016, I was fortunate enough to be involved in co-presenting this session and I would highly recommend it.  Hicham Mourad is an expert on capacity management and he always delivers a fast paced and interactive presentation.  Last year this session was a top 10 session for attendance and rating.  Hicham will take you through a deep understanding of the different capacity and efficiency badges and how they are calculated, and he will explain in depth the different capacity models.  Expect to see a demo also. As long as Hicham is doing this session, I will be in attendance.  Here is a pic of Hicham and I presenting!

vSphere APIs with Alan Renouf and Kyle Ruddy (SER3036GU)
Just look at the title – Alen Renouf and Kyle Ruddy  – are you kidding me!  Two giants in the field of APIs.  This is one I will register for.  I am looking forward to learn about vSphere APIs and how to use them.  This session will deliver some really great content.

The Top 10 Things to Know About vSAN (STO1264BU)
Duncan Epping and Cormac Hogan – BOOOOM!   This is the mother load of vSAN presentations. I really don’t need to type anything else, but just in case you need more……. Cormac and Duncan will go over starting from the design phase and benchmarking to the operational aspect of vSAN.  I cant image a more informative session on vSAN.  Make sure you favorite this session, it will fill up right away!  Im bringing my autograph book!

VMware Cloud on AWS – Getting Started Workshop (ELW18801U)
What to get some hands on with VMware Cloud interface to perform basic tasks and manage your public cloud capacity!!??  Hell yeah!

VMware Cloud on AWS: A Technical Deep Dive (LHC2384BU)
Frank Denneman and Ray Budavari are two of the most technical speakers around.  This session will take a closer look at key features of VMware Cloud on AWS, such as elastic cluster and NSX networking functionality.  I clicked the star on this one… don’t miss it!

NSX and VMware Cloud on AWS: Deep Dive (LHC2103BU)
This is another Ray Budavari presentation.  He is like the Papa Smurf of NSX, a true NSX OG! This session will take you through the connectivity models for VMware Cloud on AWS and how NSX provides consistent networking on security between on premises deployments and public cloud…plus a whole lot more!

So there you are, just a few of the amazing sessions coming up at VMworld US 2017, that I will be attending.  There are so many more to choose from, all the content looks good.  I know my schedule will be filled to the brim!  Don’t forget to allow a little time to do some Hands On Labs and check out the Solutions Exchange and Hang Space.   Also make sure to stop by the VMUG booth and if you are not a member register and get involved in the community!

See ya in Vegas, Baby!
Dan


Considerations for Capacity Management with vROps

Navigating your way around capacity management is not and easy task, especially at a large company where it seems almost impossible to get your arms wrapped around it. HA – I picture a large tree and trying to hug it, not quite able to lock your fingers on the other side! It’s really kind of like that. You got most of it, but you are always reaching. At times you need to step back and re-evaluate your angle or approach. Over the last year or so I’ve been working with the capacity management team to choose exactly the right metrics to determine the best way to evaluate capacity. Last week one cluster, according to vROPs, was in desperate need of capacity, we were running into our buffers; however when we looked closely in our review meeting we noticed that the reason we were out of capacity was due to CPU Demand. This spun off a number of weekly meetings to re consider our approach or angle to see if we can get our fingers locked. In all honesty, this wasn’t an oversight, we have a pretty smart group of people and we meet regularly to review. Everyone on our team has the same goal and these types of discussions make sure we are staying on target; however we did realize that we needed a deeper understanding of the different types of capacity models and how to apply them as policies across the virtual infrastructure. So let’s start with a quick level set and go from there. All right, here we go!

Allocation Model
This model is capacity based on the configured amount of resources assigned to a VM or VMs in a cluster. The consensus is that this model should be used for production environments where you have important workloads, and you want to be able to keep resources for fail-over, and you want to make sure you don’t over commit by too much. You decide your over commitment ratio and set that in the policy. This is the most conservative capacity model.

Demand Model
The Demand model is often used in Test/Development environments where you don’t necessarily care about over allocation, and you really want to get as many guests as possible in the environment. If you are using this model you probably don’t care if the hosts are running hot. You will likely be way over allocated but again you don’t care because you want to run this for highest possible VM density.

Memory Consumed model
This model allows you to see the memory resources used just like you would in the vSphere client. It shows the active memory, plus shared memory pages, plus recently touched memory. All the memory overhead.

So which one do we choose? That’s an excellent question. In all likely hood, we are going to look at all these models and how they affect capacity. We have, and I’m guessing you do too, clusters with mixed workloads or due to licensing considerations clusters where you have to mix test/dev hosts with production hosts. So its not so easy to just pick one or the other and go with it, especially when you have to scale up the environment to meet the needs of the company. Our team decided to start to implement different policies specific to the cluster and workloads in those clusters. The polices will include different allocation over-commit ratios for CPU/Memory and Disk. Some policies will account for all three models others will just be one or a combination. What’s really great is vRealize Operations is so flexible its really easy to dial in capacity just the way you want it. One other decision we made that you might want to consider is that we will only rely on the data in vROPs for capacity management. We wont look at what vCenter is showing for cluster resources used to determine if we can “fit” more VMs in. Capacity management is not easy, it takes time to collect metric data, analyze it and then tweak it so you are sure you can make the best decisions. Sometimes those decisions can save (or cost) your company a significant amount of money. The good news is there is no magic going on there. If you put in the work and use a great tool like vRealize Operation Manager you will get to a point where real value will be realized with vROPs. Now that our team has determined to use a combination of models, we can then begin to adjust policies and review data that’s already been collected to make sure we are using metrics that meet our needs. I’d love to hear how others are using vROPs to determine capacity and some of the challenges and success you have encountered. If you read this and want to share, add a comment.

I’d like to thank Hicham Mourad for his help with some questions and his guidance along the way. He is a really smart guy, and Im thankful I can reach out to him when I need to. 🙂

vRealize Operations Manager 6.3 – What’s New!

Today VMware has released vRealize Operations Manager 6.3. vROps will maximize capacity utilization and enable optimum performance and availability of applications and infrastructures across vSphere, Hyper-V, Amazon, and physical hardware.  Streamline key IT processes with out-of-the-box and customizable policies, guided remediation and automated standards enforcement. Optimize performance, capacity and compliance while retaining full control of IT operations.

After I get back from VMworld I will be testing all the new features.  I’m looking forward to the DRS Dashbords!  Until then check out below all the new features.

What’s New in vROps 6.3

vRealize Operations Manager 6.3 is a release update that enhances product stability, performance, and usability.

Enhanced Workload Placement and vSphere Distributed Resource Scheduler (DRS) Integration:

  • Recommended Actions on landing page
  • Configure DRS from vRealize Operations Manager with Cluster/DRS Dashboard
  • Data Collection Notification toolbar
  • Perform Actions from Workload Utilization Dashboard

Improved Log Insight Integration:

  • Management Pack for Log Insight included in product
  • Improved Log Insight and vRealize Operations Manager alerting

Enhanced vSphere Monitoring:

  • Support vSphere 6.0 Hardening Guide
  • vRealize Operations Manager Compliance for vSphere 6.0 Objects
  • vRealize Operations Manager and vCenter Software-Defined Data Center (SDDC) Health Dashboards

General improvements:

  • New API Programming Guide
  • New licensing plan for vRealize Operations Manager Standard and Advanced Editions
  • Filtered SNMP Trap Alert Notifications
  • Enhanced SuperMetric capabilities
  • Reduction in default metrics collected

Source – vROps 6.3 release notes

Removing a Solution from vRealize Operations Manager 6.x

The great thing about having a lab environment is I get to test out a number of solutions for vROps.  One that I have been evaluating is the Cisco UCS Management Pack for vROps.   We started with a beta version for vROps 5.x then updated the pack for vROps 6.1 and now I wanted to install the newest version of the pack for 6.2.  One problem, the old solutions are just kinda stuck in there.  They don’t update and when you think you are removing the solution, you are really just deleting the adapter settings.  In this article ill go through the steps on how to remove the old management packs and get everything clean and ready for the new version.

***Caution!*** – we are going to be editing some sensitive files so you really should open up a service request with VMware support if you are doing this in production.  I’m working in my lab environment  so if things went FUBAR, its not a big deal.   I will have to eventually do this in production, (well not me, the operations team) and so far I haven’t had any issues going through this, but ya never know.  Open up an SR before touching your production vROps.  This way in an event of an issue or a mistake VMware support can help guide you through fixing it. Okay, enough of that.

The fist step is to log into the vROps node that has the incompatible solution. In my lab I only have one node, so that’s pretty straight forward.

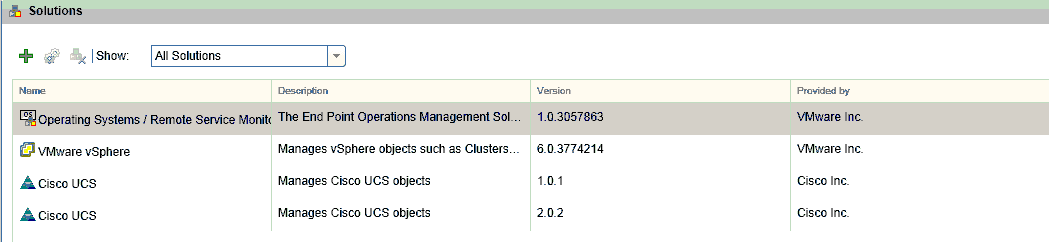
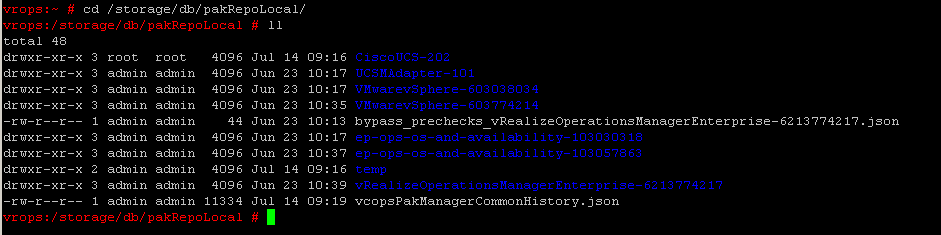
navigate to /storage/db/pakRepoLocal/  to determine which solution you want to uninstall.  I have a couple different UCS solutions installed.

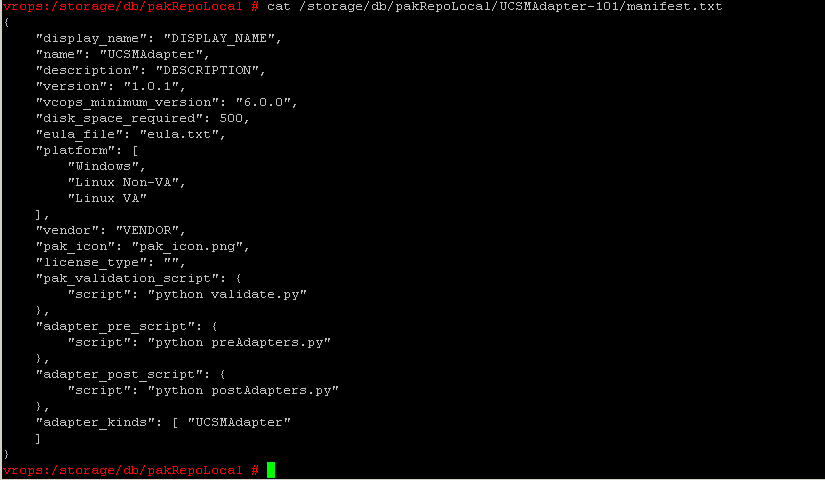
Run this command to determine the actual adapter name and take note of the “Name” field.
cat /storage/db/pakRepoLocal/Adapter_Folder/manifest.txt

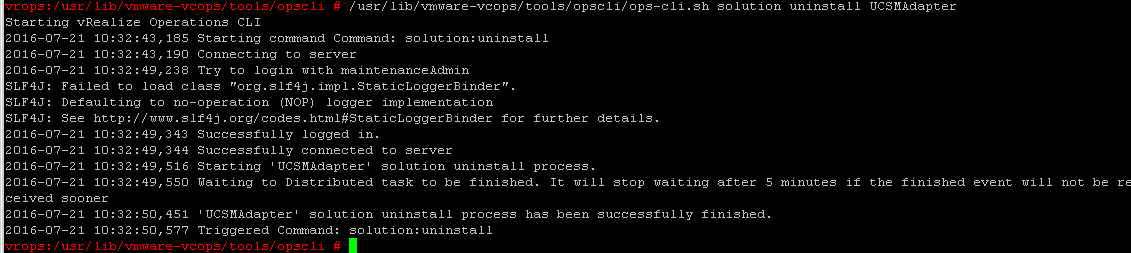
The next step to uninstall the solution pack is to change to /usr/lib/vmwarevcops/tools/opscli/   and run the opscli.sh with the uninstall option
./opscli.sh solution uninstall “Name_of_the_pak”

Once the process has completed you will see a return that states the uninstall has been successful. Like in the example below.

After the above step is complete, run this for some additional clean up.
$VMWARE_PYTHON_BIN $ALIVE_BASE/../vmwarevcopssuite/utilities/pakManager/bin/vcopsPakManager.py –action
cleanup –remove_pak –pak Name_of_Pak     (replace Name_of_Pak with the name from above)

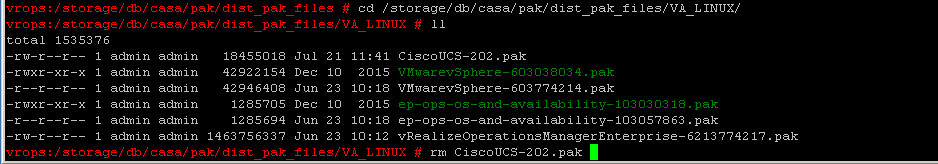
Next you will have to remove the solutions .pak file from the .pak files directory.
Go to $STORAGE/db/casa/pak/dist_pak_files/VA_LINUX  and rm the pack file name.

Now open /storage/db/pakRepoLocal/vcopsPakManagerCommonHistory.json in a text editor and delete all entries related to the removed solution from { to }   Don’t forget to save it!

Lastly go back to the /storage/db/pakRepoLocal/  directory and remove the sub directories, files and parent directory for the solution you removed.  Use the rm and rmdir commands.   You may also have to delete any dashboards that were installed with the solutions pack from dashboards in the vRealize Operations Manager UI.  Also note that in order for the changes to take effect, you will need to log out and back into the UI.

Take your time running through the steps and you will see its not all that difficult.  I’ve also used this process when a solution doesn’t install successfully before I try and reinstall it and remember to take caution when doing this in a production environment.

Reclaiming CPU and Memory in vROPs 6.2

Hi there everyone, where I work we’re pretty lucky to have a really nice test lab. This is an environment that is for the most part isolated from production, development and certification. Its an Engineering only sandbox for proof of concept and testing; however its still a fully functioning data center and there are a number of infrastructure systems that are relied on to keep the lab running smoothly and even though we have a budget for adding virtual infrastructure capacity there comes times when we start to run hot on CPU and more so memory in our VMware environment. The cool thing is we can use the Reclaimable Capacity section in vROps to identify which resources are being consumed and which guests are the trouble makers and by configuring the vCenter Python Action Adapter we can modify objects in vCenter right from vRealize Operations Manager… how awesome is that!

I wanted to write up a nice walk through on how to configure the Python Adapter and use the Reclaimable Capacity section in vRealize Operations Manager to figure out which guests and how much capacity you can recover; however when I was doing some research on the subject I came across Jason Gaudreau’s blog where he expertly explains in detail everything I would of shared with you all. Jason and I have spoke on the phone a few times as he has helped me work out a couple things or given me direction. He’s really an expert so check out his post Right-Sizing with vRealize Operations 6.0

vRealize Operations – Resource Interaction XML File

Hey everybody, so a few months ago I wanted to give our Operations team a quick and dirty dashboard to quickly view some very basic metrics to determine at a glance what’s happening to a guest. I knew I wanted an Object List, Top Alerts, Workload and a Metric Chart, the problem I was having is that the default view on the metric chart widget didn’t gave me the metrics I wanted to display. The good news is that you can create a custom XML file that you can choose in the Metric Configuration drop down menu when configuring the widget.

First off we need to make sure that to use the metric configuration dashboard and widget, configurations must be set up so the Widget Interactions are configured so that another widget provides objects to the target widget, like an Object List and the widget Self Provider is set to off. The custom XML file that we will choose from the drop down when configuring the Metric Chart widget needs to be imported into the global storage using the import command. Ill show you how to do that in the next couple steps.

Next we create our custom XML file with the metrics we want. vROPs offers so many metrics to choose from, so pick ones that make sense to you. I decided to use CPU Usage (%), Memory Usage (%), and Virtual Disk Aggregate of all Instances Total Latency. Below is the XML code I used.


After you have created your XML file, the next process is to save the XML file to your vROPs server and import it into the global storage. Depending if you are using a vApp/Linux server or Windows server the location will be different. Im running the linux appliance.
vApp or Linux – /usr/lib/vmware-vcops/tools/opscli
Windows – C:\vmware\vcenter-operations\vmware-vcops\tools\opscli

Now its time to import the file, pretty simple. run the following: (from the directory)
vApp or Linux – $VMWARE_PYTHON_BIN ./ops-cli.py file import reskndmetric YourCustomFilename.xml
Windows – ops-cli.py file import reskndmetric YourCustomFilename.xml

Lastly, when you create your dashboard and edit your Metric Chart widget, in the Metric Configuration drop down you can now select your custom XML file to display the metrics you want to see.


If you would like to use my XML file or dashboard, download it here:
dashboard.zip

vRealize Operations Manager – HA and Capacity Buffers

At my company, I work closely with our Capacity Management team. Their role is to collect data points from various teams (storage, VMware, etc.) and determine what the current state of capacity is. That is way over simplifying what they do and the value they bring to the teams they work with is very high, and the recommendation to purchase or when to delay purchase can save the company a lot of money. I use vROPs to publish weekly reports with a number of metrics that the capacity management team uses to determine what clusters need more capacity, what clusters dont and if we can shift capacity from one that has extra to one that is desperately low. Even though the reports they get from vROPs provide many metrics, we key in on average remaining vms that can fit in a cluster. A few weeks ago, I upgrade vROPs from 6.1 to 6.2 and we found out that the calculations were just a bit off from what we have normally seen and that caused me to dig deeper into what actually is happening to determine how many remaining VMs can fit in a cluster.

vROps calculates the remaining vms based on the HA and capacity buffers set by the vROPs policy and vCenter Admission Control. The reason why we see a difference from 6.1 to 6.2 is there is not a change in the way vROps deals with capacity rather there is a difference in how vROps integrates with Admission Control in 6.2 and this would account for the discrepancy. Before we dig a little deeper into the buffers, lets take a look at Admission Control

vCenter Server uses admission control to ensure that sufficient resources are available in a cluster to provide failover protection and to ensure that virtual machine resource reservations are respected. There are three types of admission control. For this explanation, we’ll just focus on vSphere HA. vSphere HA ensures that sufficient resources in the cluster are reserved for virtual machine recovery in the event of host failure. Admission Control imposes constraints on resource usage and any action that would violate these constraints is not permitted like powering on a VM, migrating a VM to a host, or increasing the CPU and memory reservation of a VM. Only one type of Admission Control can be disabled – vSphere HA.


This is why when we look in vROps at remaining capacity in a cluster we see “HA (0%)” in the buffers column.


It’s important to note that the reason why we see the “HA (0%)” is because enabled (by default) in the vROps policy is to use High Availability Configurations check box; however for this example Admission Control is disabled in vCenter and because of that the percentage remains 0.


If Admission Control is enabled, one option is to define failover capacity by a percentage, this would be represented in vROps by a number in the “HA (0%)”


If you unchecked in the vROps policy the Use High Availability Configuration option. The “HA (0%)” is removed from the buffer column in the remaining capacity section.


The other part of the buffers is the “+10%”. This is an additional capacity buffer controlled by vROps policy and by default it was set at 10%. We do have the ability to adjust that buffer if needed.


If we do that math in any cluster we can see that the usable capacity that vROps is reporting for CPU and Memory (as well as disk) is correct. For example: usable memory capacity is physical host memory times the overcommit minus buffers. This is how we can confirm that vROps is accurate. I also believe that the remaining number of VM left to fit is accurate because it uses these numbers to determine how much remaining capacity is left. I’ve asked VMware support if they can provide me the math behind determining the number of average VMs left to fit in a cluster so I can double check the calculations. I’m waiting their response. The discrepancy in the reports I wrote about in the beginning of this post, is due to VMware making general improvements to their product and the integration with the Admission Control setting in 6.2. There is nothing specific in the release notes from VMware that was specific to this; however support told me that they have had other cases in relation to these settings in 6.2. Roomer has it VMware is working towards more interoperability between the two products in Vsphere 6.5 Im assuming vROps version 6.2 is prepping for that integration.