Hi everyone. In this episode of VM in Five I cover VMware’s new release vRealize Operations 8.0
VM in Five – vRealize Operations 8.0
1 Reply
Hi everyone. In this episode of VM in Five I cover VMware’s new release vRealize Operations 8.0
Today VMware has released vRealize Operations Manager 6.3. vROps will maximize capacity utilization and enable optimum performance and availability of applications and infrastructures across vSphere, Hyper-V, Amazon, and physical hardware. Streamline key IT processes with out-of-the-box and customizable policies, guided remediation and automated standards enforcement. Optimize performance, capacity and compliance while retaining full control of IT operations.
After I get back from VMworld I will be testing all the new features. I’m looking forward to the DRS Dashbords! Until then check out below all the new features.
What’s New in vROps 6.3
vRealize Operations Manager 6.3 is a release update that enhances product stability, performance, and usability.
Enhanced Workload Placement and vSphere Distributed Resource Scheduler (DRS) Integration:
Improved Log Insight Integration:
Enhanced vSphere Monitoring:
General improvements:
Source – vROps 6.3 release notes
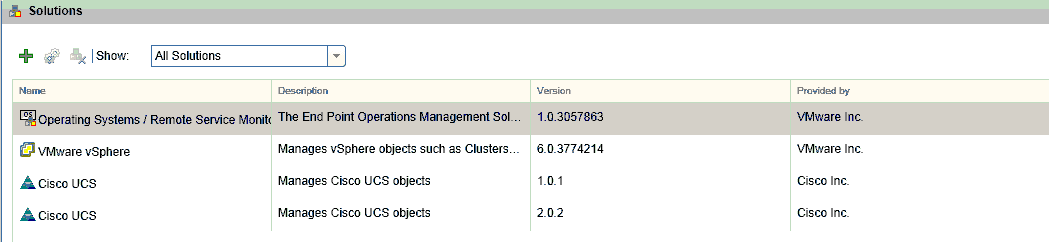
The great thing about having a lab environment is I get to test out a number of solutions for vROps. One that I have been evaluating is the Cisco UCS Management Pack for vROps. We started with a beta version for vROps 5.x then updated the pack for vROps 6.1 and now I wanted to install the newest version of the pack for 6.2. One problem, the old solutions are just kinda stuck in there. They don’t update and when you think you are removing the solution, you are really just deleting the adapter settings. In this article ill go through the steps on how to remove the old management packs and get everything clean and ready for the new version.
***Caution!*** – we are going to be editing some sensitive files so you really should open up a service request with VMware support if you are doing this in production. I’m working in my lab environment so if things went FUBAR, its not a big deal. I will have to eventually do this in production, (well not me, the operations team) and so far I haven’t had any issues going through this, but ya never know. Open up an SR before touching your production vROps. This way in an event of an issue or a mistake VMware support can help guide you through fixing it. Okay, enough of that.
The fist step is to log into the vROps node that has the incompatible solution. In my lab I only have one node, so that’s pretty straight forward.
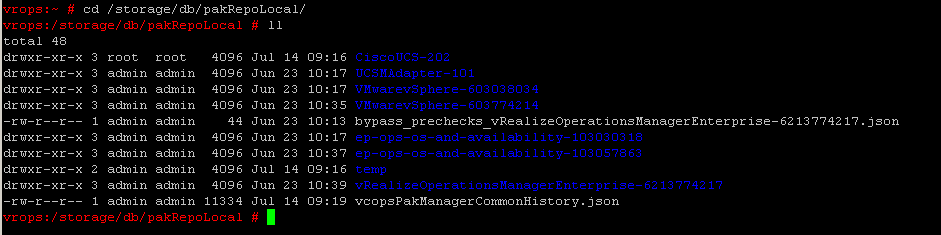
navigate to /storage/db/pakRepoLocal/ to determine which solution you want to uninstall. I have a couple different UCS solutions installed.
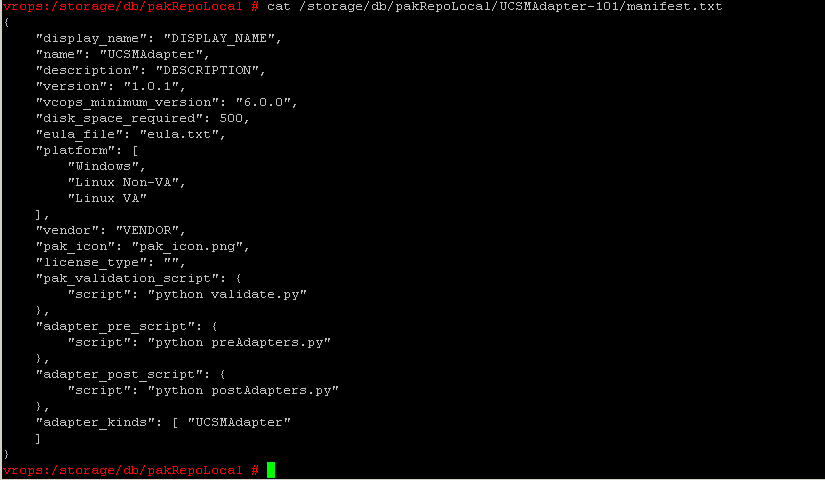
Run this command to determine the actual adapter name and take note of the “Name” field.
cat /storage/db/pakRepoLocal/Adapter_Folder/manifest.txt
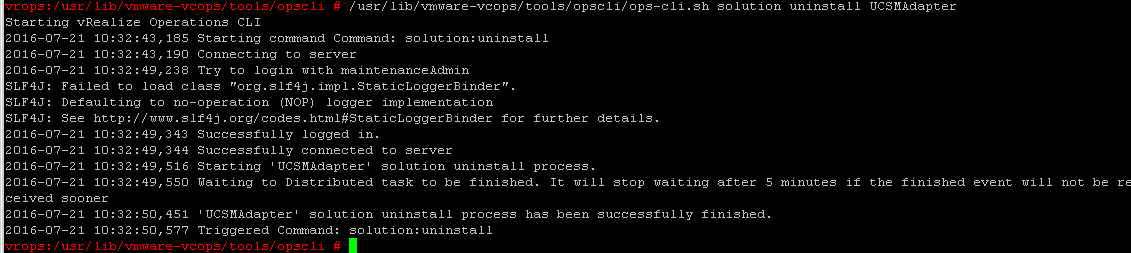
The next step to uninstall the solution pack is to change to /usr/lib/vmwarevcops/tools/opscli/ and run the opscli.sh with the uninstall option
./opscli.sh solution uninstall “Name_of_the_pak”
Once the process has completed you will see a return that states the uninstall has been successful. Like in the example below.
After the above step is complete, run this for some additional clean up.
$VMWARE_PYTHON_BIN $ALIVE_BASE/../vmwarevcopssuite/utilities/pakManager/bin/vcopsPakManager.py –action
cleanup –remove_pak –pak Name_of_Pak (replace Name_of_Pak with the name from above)
![]()
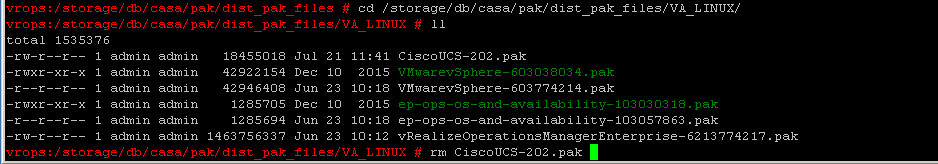
Next you will have to remove the solutions .pak file from the .pak files directory.
Go to $STORAGE/db/casa/pak/dist_pak_files/VA_LINUX and rm the pack file name.
Now open /storage/db/pakRepoLocal/vcopsPakManagerCommonHistory.json in a text editor and delete all entries related to the removed solution from { to } Don’t forget to save it!

Lastly go back to the /storage/db/pakRepoLocal/ directory and remove the sub directories, files and parent directory for the solution you removed. Use the rm and rmdir commands. You may also have to delete any dashboards that were installed with the solutions pack from dashboards in the vRealize Operations Manager UI. Also note that in order for the changes to take effect, you will need to log out and back into the UI.
Take your time running through the steps and you will see its not all that difficult. I’ve also used this process when a solution doesn’t install successfully before I try and reinstall it and remember to take caution when doing this in a production environment.
Hey everybody, so a few months ago I wanted to give our Operations team a quick and dirty dashboard to quickly view some very basic metrics to determine at a glance what’s happening to a guest. I knew I wanted an Object List, Top Alerts, Workload and a Metric Chart, the problem I was having is that the default view on the metric chart widget didn’t gave me the metrics I wanted to display. The good news is that you can create a custom XML file that you can choose in the Metric Configuration drop down menu when configuring the widget.
First off we need to make sure that to use the metric configuration dashboard and widget, configurations must be set up so the Widget Interactions are configured so that another widget provides objects to the target widget, like an Object List and the widget Self Provider is set to off. The custom XML file that we will choose from the drop down when configuring the Metric Chart widget needs to be imported into the global storage using the import command. Ill show you how to do that in the next couple steps.
Next we create our custom XML file with the metrics we want. vROPs offers so many metrics to choose from, so pick ones that make sense to you. I decided to use CPU Usage (%), Memory Usage (%), and Virtual Disk Aggregate of all Instances Total Latency. Below is the XML code I used.

After you have created your XML file, the next process is to save the XML file to your vROPs server and import it into the global storage. Depending if you are using a vApp/Linux server or Windows server the location will be different. Im running the linux appliance.
vApp or Linux – /usr/lib/vmware-vcops/tools/opscli
Windows – C:\vmware\vcenter-operations\vmware-vcops\tools\opscli
Now its time to import the file, pretty simple. run the following: (from the directory)
vApp or Linux – $VMWARE_PYTHON_BIN ./ops-cli.py file import reskndmetric YourCustomFilename.xml
Windows – ops-cli.py file import reskndmetric YourCustomFilename.xml
Lastly, when you create your dashboard and edit your Metric Chart widget, in the Metric Configuration drop down you can now select your custom XML file to display the metrics you want to see.

If you would like to use my XML file or dashboard, download it here:
dashboard.zip
At my company, I work closely with our Capacity Management team. Their role is to collect data points from various teams (storage, VMware, etc.) and determine what the current state of capacity is. That is way over simplifying what they do and the value they bring to the teams they work with is very high, and the recommendation to purchase or when to delay purchase can save the company a lot of money. I use vROPs to publish weekly reports with a number of metrics that the capacity management team uses to determine what clusters need more capacity, what clusters dont and if we can shift capacity from one that has extra to one that is desperately low. Even though the reports they get from vROPs provide many metrics, we key in on average remaining vms that can fit in a cluster. A few weeks ago, I upgrade vROPs from 6.1 to 6.2 and we found out that the calculations were just a bit off from what we have normally seen and that caused me to dig deeper into what actually is happening to determine how many remaining VMs can fit in a cluster.
vROps calculates the remaining vms based on the HA and capacity buffers set by the vROPs policy and vCenter Admission Control. The reason why we see a difference from 6.1 to 6.2 is there is not a change in the way vROps deals with capacity rather there is a difference in how vROps integrates with Admission Control in 6.2 and this would account for the discrepancy. Before we dig a little deeper into the buffers, lets take a look at Admission Control
vCenter Server uses admission control to ensure that sufficient resources are available in a cluster to provide failover protection and to ensure that virtual machine resource reservations are respected. There are three types of admission control. For this explanation, we’ll just focus on vSphere HA. vSphere HA ensures that sufficient resources in the cluster are reserved for virtual machine recovery in the event of host failure. Admission Control imposes constraints on resource usage and any action that would violate these constraints is not permitted like powering on a VM, migrating a VM to a host, or increasing the CPU and memory reservation of a VM. Only one type of Admission Control can be disabled – vSphere HA.
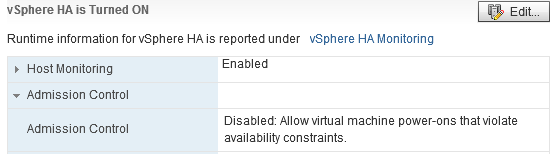
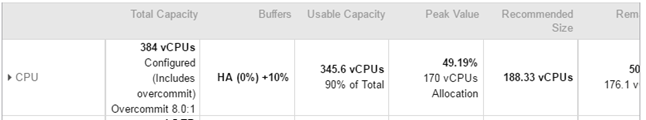
This is why when we look in vROps at remaining capacity in a cluster we see “HA (0%)” in the buffers column.
It’s important to note that the reason why we see the “HA (0%)” is because enabled (by default) in the vROps policy is to use High Availability Configurations check box; however for this example Admission Control is disabled in vCenter and because of that the percentage remains 0.

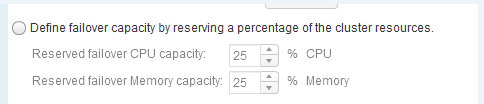
If Admission Control is enabled, one option is to define failover capacity by a percentage, this would be represented in vROps by a number in the “HA (0%)”
If you unchecked in the vROps policy the Use High Availability Configuration option. The “HA (0%)” is removed from the buffer column in the remaining capacity section.

The other part of the buffers is the “+10%”. This is an additional capacity buffer controlled by vROps policy and by default it was set at 10%. We do have the ability to adjust that buffer if needed.

If we do that math in any cluster we can see that the usable capacity that vROps is reporting for CPU and Memory (as well as disk) is correct. For example: usable memory capacity is physical host memory times the overcommit minus buffers. This is how we can confirm that vROps is accurate. I also believe that the remaining number of VM left to fit is accurate because it uses these numbers to determine how much remaining capacity is left. I’ve asked VMware support if they can provide me the math behind determining the number of average VMs left to fit in a cluster so I can double check the calculations. I’m waiting their response. The discrepancy in the reports I wrote about in the beginning of this post, is due to VMware making general improvements to their product and the integration with the Admission Control setting in 6.2. There is nothing specific in the release notes from VMware that was specific to this; however support told me that they have had other cases in relation to these settings in 6.2. Roomer has it VMware is working towards more interoperability between the two products in Vsphere 6.5 Im assuming vROps version 6.2 is prepping for that integration.
